
Quality SMID Cap: an Inflection Point?
Since mid-2025, the lowest-quality stocks in the SMID cap market have led. This is the fifth sustained low-quality rally in our quality model's nearly 25-year history, and by one measure the deepest, and it has been a major headwind for a strategy built to own the highest-quality businesses. The history matters for long-term investors. Following any 12-month stretch in which high quality trailed the market, the highest-quality stocks went on to outperform the universe over the following three and five years in 100% of the historical observations in our analysis, although these observations overlap and represent a limited number of distinct market episodes, with the strongest relative returns coming immediately after stretches like today's. Quality snapped back sharply in early summer, and July was the factor's best month in a decade. August showed the rotation remains contested, but we believe today looks like the historical setups that preceded the strategy's best relative runs, and a historically attractive backdrop for quality-oriented strategies like the Johnson SMID Cap Core equity strategy.
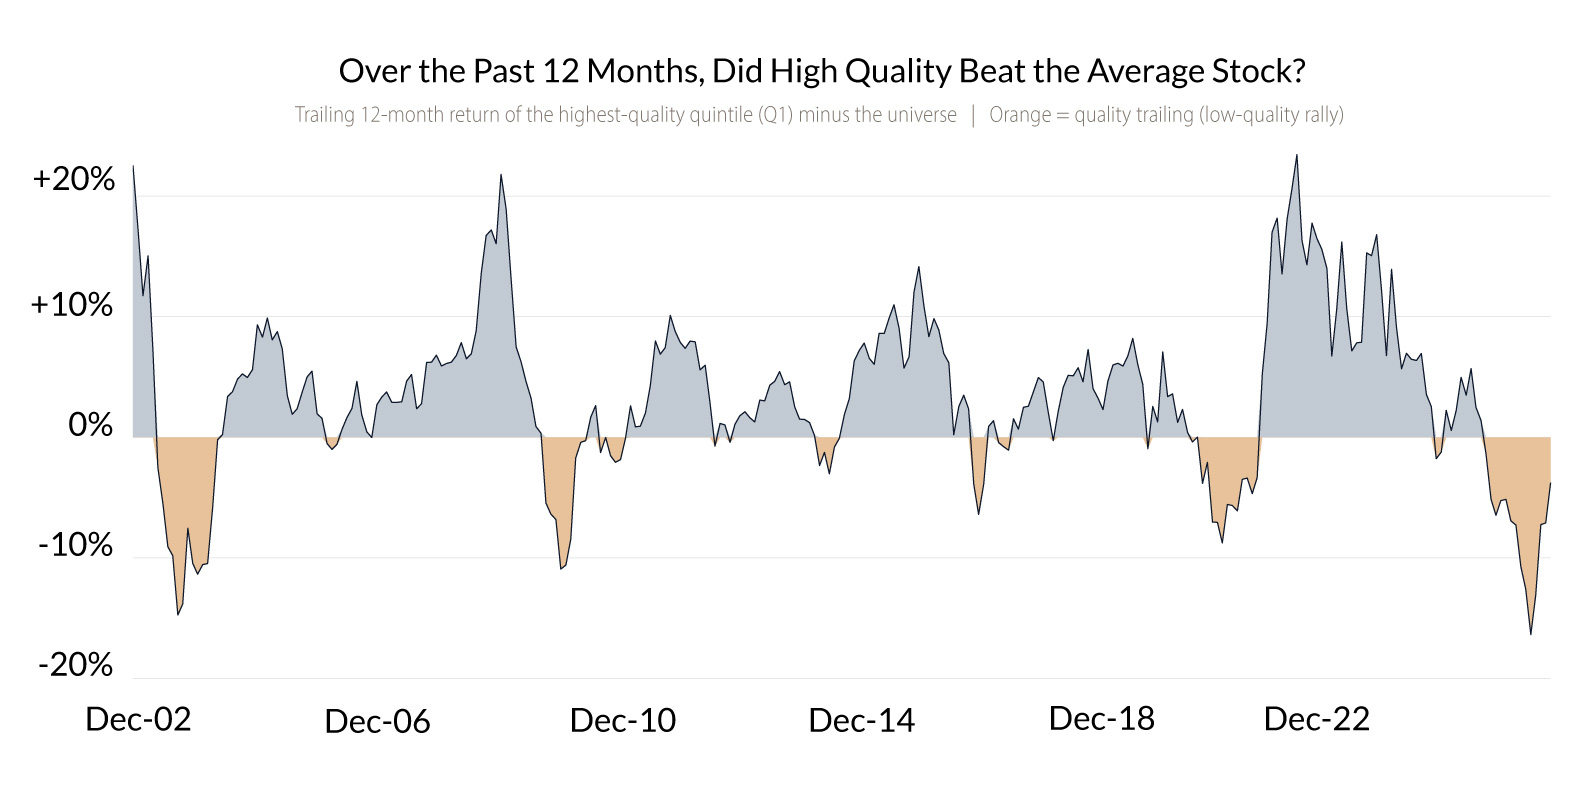
Source: FactSet, Johnson Asset Management. Monthly data, Jan 2002 - Sep 2026 (297 months). Russell 2500 constituents sorted into quintiles by JAM's proprietary 7-factor quality model; “high quality” (Q1) = top quintile, equal-weighted, sector-neutral, rebalanced monthly. Each point is the trailing 12-month return of the top quintile minus the universe; orange marks periods when quality trailed (low-quality rallies). “The average stock” and “the universe” mean the equal-weighted average of Russell 2500 constituents the model can score; constituents that cannot be ranked are excluded. This is not the cap-weighted Russell 2500 index. Over this period, the equal-weighted universe returned +8.7% annualized versus +9.9% for the index (gross total return). Quintile, universe, and index figures are all gross total returns, so the difference between them reflects weighting rather than dividend treatment. Superlatives such as “deepest on record” are through August 2026; the current episode remains open. Hypothetical factor construction, gross of fees and trading costs; not an investable portfolio. Past performance does not guarantee future results. See disclosures.
What the Chart Shows
Each point on the chart answers one question: over the twelve months just ended, did the highest-quality quintile (Q1) of SMID cap stocks beat the average stock, and by how much? Navy means quality led, which it did in 74% of all twelve-month windows. The orange stretches are the exceptions, five sustained low-quality rallies: the dot-com recovery (2003-04), the post-GFC rally (2009-11), the 2016-17 reflation, the post-COVID rally (2020-21), and the current episode, whose May 2026 reading of -16.4% is the deepest in the model’s history since 2002. Staying on the navy side has compounded into a large advantage. Over the full period the top quintile returned +12.7% annualized versus +8.7% for the universe, turning $1 into $19.27 versus $7.87 for the average stock, while the lowest-quality quintile returned less than 1% annualized. Every completed orange episode ended with quality recovering its lead. Bear in mind, the quality-factor results shown are not results of the Johnson SMID Cap Core strategy, which differs from the model in portfolio construction, security selection, weighting, fees and implementation.
What Has Followed Low-Quality Rallies
The pattern has been consistent. Across every month in our data, the highest-quality quintile beat the universe in 74% of all trailing 12-month windows, illustrating the historical benefit of maintaining exposure rather than attempting to time the factor. Rolling periods overlap and therefore should not be interpreted as independent observations. But entry points after quality had underperformed for a year were historically the most rewarding:
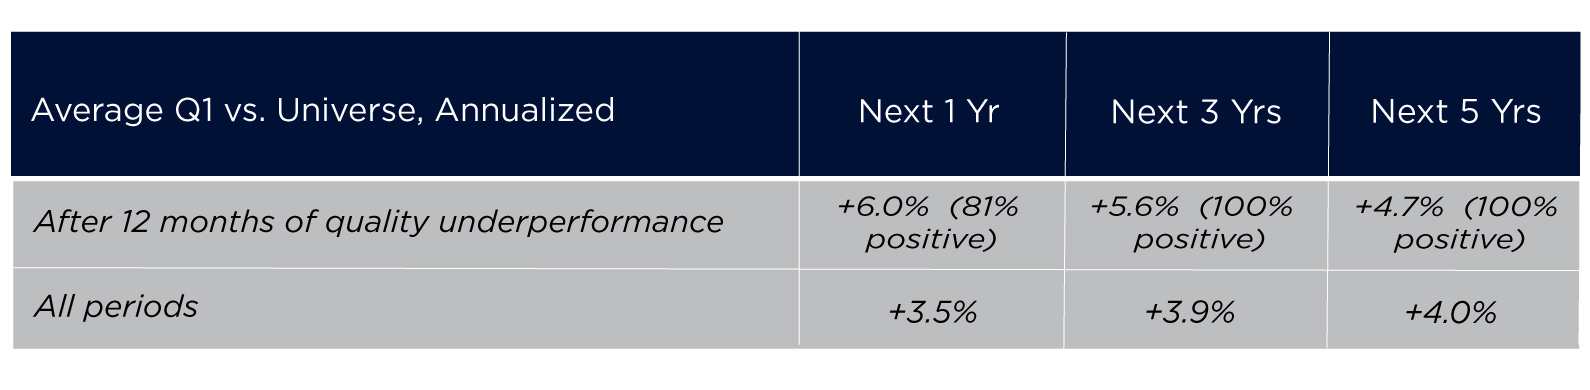
Q1 vs. the equal-weighted universe of ranked Russell 2500 constituents (not the cap-weighted index), Jan 2002 - Sep 2026; 64/60/59 overlapping monthly observations following 12-month underperformance for the 1/3/5-year windows. Because the windows overlap month to month, they represent roughly four to five independent episodes rather than 63 independent outcomes. Averages are of annualized forward relative returns, gross of fees and trading costs. Past performance does not guarantee future results.
The current episode has been severe. Beyond the record 12-month deficit visible on the chart, the gap between the highest- and lowest-quality quintiles reached 72 points in May 2026, the widest since 2003. The early summer rebound carried the chart's reading back to -3.8% by the end of the third quarter. That is an inflection, but it is still a backdrop that has historically been associated with stronger subsequent relative returns.
Why This Matters for SMID Cap Core
The Johnson SMID Cap Core strategy owns the kinds of businesses the quality model is built to find, so its relative performance has historically tracked the quality factor, including the headwind from the low-quality rally that began in mid-2025. The pattern after prior episodes is instructive. 2020, the fund's most difficult relative year in the post-COVID low-quality rally (-10.1 points versus the Russell 2500), was followed immediately by its two best (+10.5 points in 2021 and +7.2 points in 2022). The strategy is not designed to win speculative rallies. It is designed to seek outperformance over a full market cycle while emphasizing downside protection by holding profitable, durable, conservatively financed businesses, and avoiding the market's most speculative names. Periods like today are the cost of that discipline. Historically, similar periods have preceded some of the strategy's strongest subsequent relative returns.
The Recent Inflection
The third quarter marked a visible shift. Market leadership broadened and the high-momentum AI and data center trades cooled. The highest quality quintile beat the equal-weighted universe by 3.94% in the third quarter – with July as the best single month for quality in a decade. The Johnson SMID Cap Core equity strategy outperformed its benchmark by 5.81% in the quarter, returning -0.56% net of fees vs. -6.37% for the Russell 2500. This included outperformance in nearly every sector, led by technology and industrials. At the same time, August also saw the market's lowest-quality names bounce back, which is a reminder that rotations are rarely a straight line. We make no prediction about when this one matures. But the conditions under which quality has historically worked, including broader market breadth, rising earnings differentiation, and fading speculative momentum, began to emerge this summer, and the portfolio remains positioned to participate if these trends continue.
Published 10/28/2026
Any expectations presented should not be taken as a guarantee or other assurance as to future results. Our opinions are a reflection of our best judgment at the time this presentation was created, and we disclaim any obligation to update or alter forward-looking statements as a result of new information, future events or otherwise. The material contained herein is based upon proprietary information and is provided purely for reference and as such is confidential and intended solely for those to whom it was provided by Johnson Asset Management. If you have any questions about our equity strategies and how we might tailor them to fit your investment objectives, please call 513.389.2770 or via email at info@johnsonasset.com.